
Oakland County Housing Market: What August 2026 Means for Buyers and Sellers
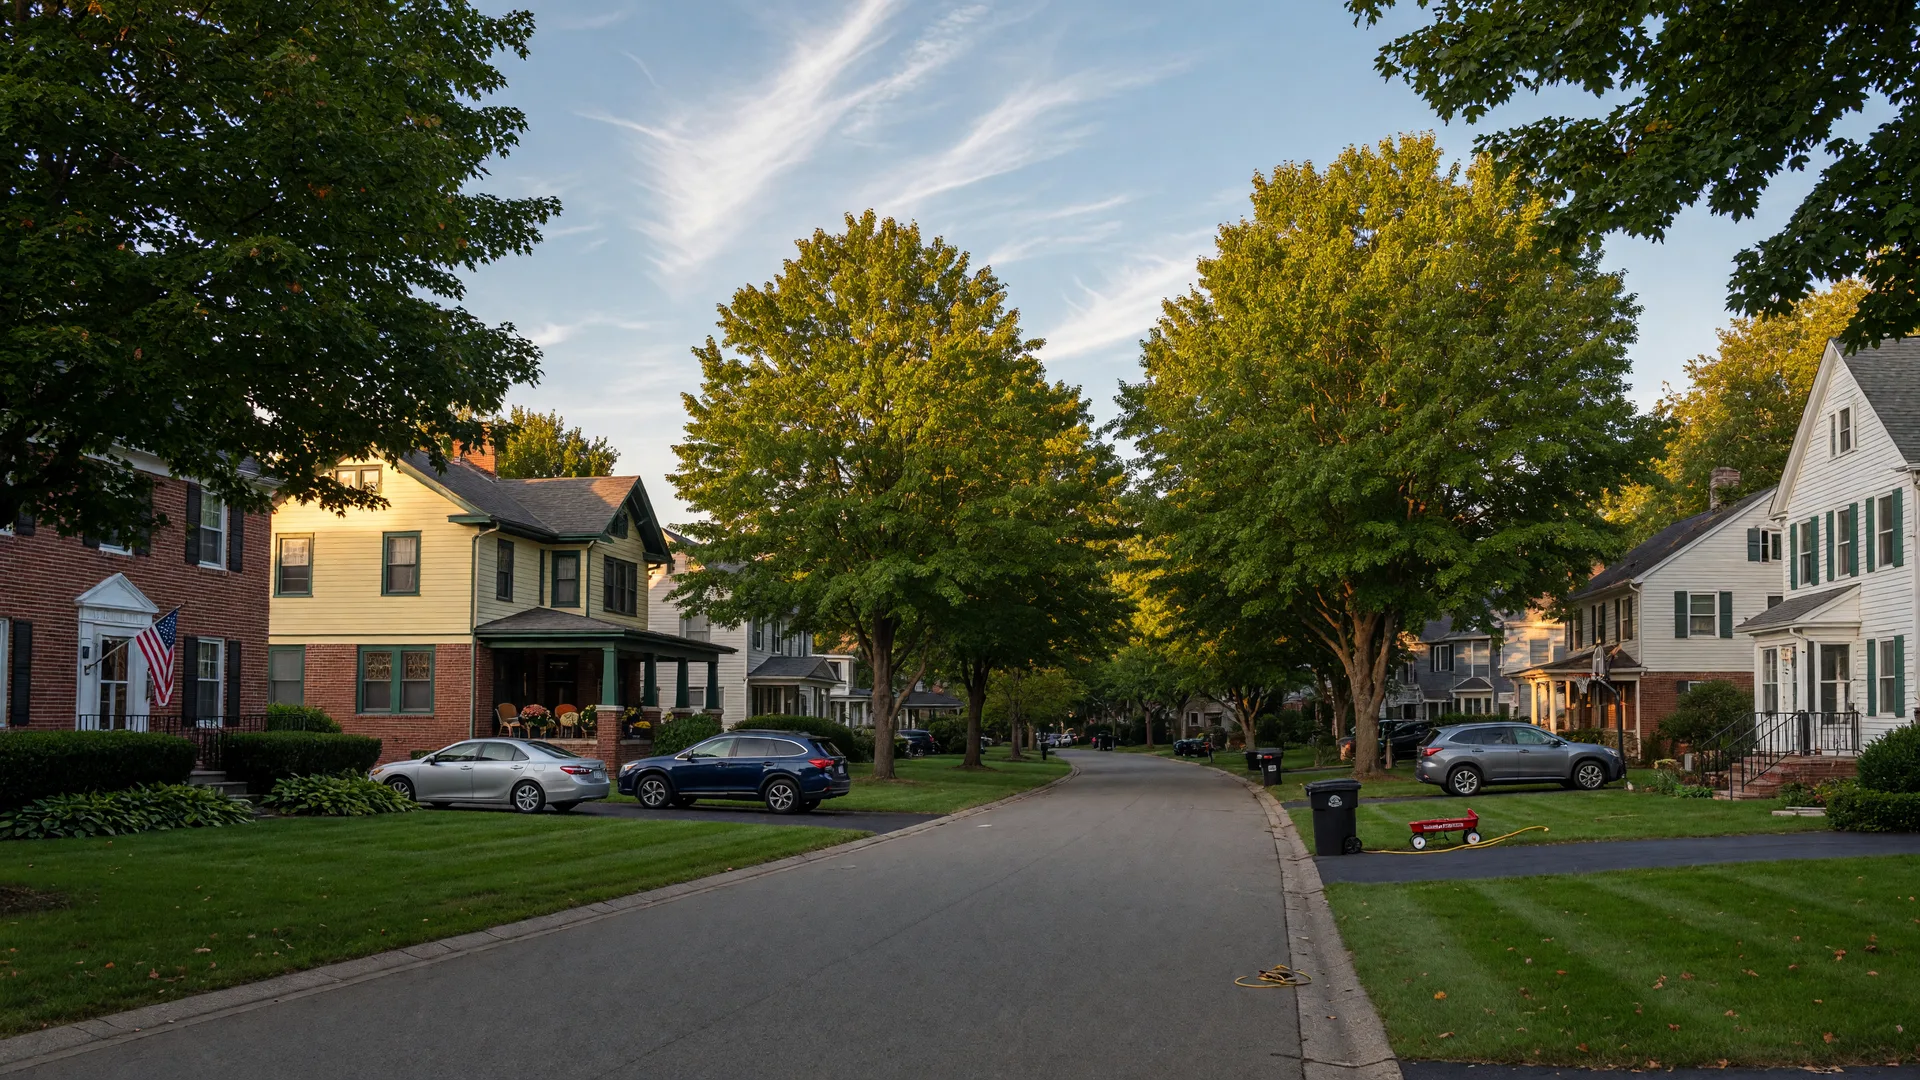
Oakland County single-family market snapshot, August 2026. Source: Realtors Property Resource®.
Is Oakland County still a seller’s market? Yes—but the August 2026 data shows a market that rewards accurate pricing and thoughtful preparation more than broad assumptions.
Single-family inventory measured 2.49 months, the median sold price reached $420,000, and homes received 99.7% of their final list price. The median property spent 16 days in RPR. Together, those numbers describe a market with limited supply and active demand, but also enough buyer choice to make strategy important.
I’m Joyce England, a REALTOR® with Keller Williams First. I help homeowners and buyers across Oakland County and Mid-Michigan interpret the numbers at the level that matters most: their location, property, price range, and plans.
Watch the Oakland County market video.
Oakland County housing market snapshot for August 2026
Oakland County recorded 1,977 new single-family listings and 2,713 active listings. The median new-listing price was $425,000, while the median active-listing price was $478,250. There were also 1,163 new pending listings with a median list price of $400,000.
The county’s median estimated property value was $410,470, up 2.2% over the previous 12 months. Estimated values are useful for observing broad movement, but they are not a substitute for a property-specific market analysis.
Is Oakland County a buyer’s or seller’s market?
With 2.49 months of inventory, Oakland County remained a seller’s market in August 2026. For context, the National Association of REALTORS® reported a 4.6-month national supply of existing homes in July. Local supply was therefore roughly 46% lower than the national level, although the reporting periods and property coverage are not identical.
Low inventory usually supports sellers, but it does not guarantee the same outcome for every property. Buyers respond differently by community, school district, condition, architecture, acreage, amenities, and price band. A move-in-ready home with attractive presentation may compete very differently from a home requiring significant work—even on the same street.
National Association of REALTORS® existing-home sales
Why the 99.7% sold-to-list ratio matters
The median sold-to-list ratio was 99.7%. This indicates that homes, in aggregate, closed very near their final asking prices. As a simple illustration, a home closing at $420,000 at that ratio would have had a final list price of approximately $421,264.
However, the ratio does not reveal the original list price, seller concessions, repairs, appraisal adjustments, or the experience of an individual home. The practical takeaway is that the market can support strong outcomes when price and positioning align with buyer expectations.
The $478,250 active price versus the $420,000 sold price
The median price of active listings was $478,250—$58,250, or about 13.9%, above the median sold price. This is an interesting indicator, but it must be interpreted responsibly. Active and sold listings are different property groups; active inventory may include larger, newer, waterfront, acreage, or luxury homes.
It is not accurate to say the typical home was overpriced by 13.9%. It is accurate to say the properties currently competing for buyers were positioned at a higher median asking price than the homes that had recently reached the closing table. Sellers should review both recent comparable sales and the active listings a buyer will see beside their home.
What 16 median days means for sellers
A 16-day median is still a relatively brisk pace, but it provides a valuable planning signal. The first days on market are when a listing is newest and most likely to capture concentrated buyer attention. Professional photography, careful preparation, accurate property information, and a launch plan should be ready before the listing goes live.
If the market response is weaker than expected, sellers should examine showing activity, feedback, online engagement, competing listings, and new sales rather than waiting for the market to validate an unsupported price.
What buyers should know about affordability
Freddie Mac reported that the average 30-year fixed mortgage rate was 6.71% on September 3, 2026. That national average does not determine any individual buyer’s rate, but it helps explain why many buyers focus intensely on the monthly payment.
Freddie Mac Primary Mortgage Market Survey
For buyers, a lower price is not the only negotiable term. Depending on the property and loan program, closing-cost assistance, repairs, occupancy, timing, or a rate buydown may also carry value. Buyers should consult their lender about financing and work with their real estate professional to structure an offer that balances competitiveness and protection.
Why hyperlocal analysis matters in Oakland County
Oakland County is not a single price point. Census benchmarks for 2020–2024 show a median owner-occupied housing value of $250,900 in Waterford Township, $369,900 in Orion Township, and $604,800 in Bloomfield Township. These figures are historical community benchmarks—not current listing or sale prices—but they illustrate the county’s enormous range.
U.S. Census Bureau, Oakland County QuickFacts
That is why the county median should begin the conversation, not end it. A useful home evaluation should consider:
- recent comparable sales near the property;
- current listings competing for the same buyer;
- failed, expired, and withdrawn listings where available;
- updates, deferred maintenance, and presentation;
- lot, square footage, architecture, and special features;
- school district and municipal boundaries;
- price-tier-specific inventory and buyer activity; and
- the seller’s timing, next purchase, and required net proceeds.
What should Oakland County sellers do now?
Prepare before going live, price from current evidence, and make the property easy to understand online. A seller’s market provides a favorable backdrop, but a polished launch and responsive strategy help convert attention into a strong, workable contract.
If you are considering a move, I can help you compare your home with the properties buyers are choosing now and develop a plan for preparation, pricing, marketing, negotiation, and your next step.
Curious what your home is worth in today’s Oakland County market? Request a personalized, no-obligation home evaluation, and I’ll show you exactly where your property stands before you plan your next move.
Market statistics are informational, reflect market-wide medians, and are not a guarantee of a particular result. A home evaluation is not an appraisal. Mortgage information is general; consult a qualified lender for advice about your circumstances. Equal Housing Opportunity.
Frequently Asked Questions
Is Oakland County, Michigan a seller’s market in August 2026?
Yes. Oakland County had 2.49 months of single-family inventory in August 2026, which indicates a seller’s market. Results still vary by community, condition, property type, and price range.
What was the median home sale price in Oakland County in August 2026?
The median sold price for single-family homes was $420,000, according to Realtors Property Resource® data supplied for this report.
How long did Oakland County homes take to sell?
The median time in RPR was 16 days in August 2026. An individual home may sell faster or slower depending on price, location, condition, marketing, and buyer demand.
Are Oakland County homes selling below asking price?
The median sold-to-list ratio was 99.7%, meaning homes collectively sold very close to their final list prices. This does not account for every original asking price or seller concession.
Should I use the county median to price my home?
No. Countywide statistics provide context, but an effective pricing strategy requires recent neighborhood comparables, current competition, property condition, features, and price-tier demand.
Keep Reading
- Buyer & Seller Resources : guides, checklists, and tools for your next move.
- The Home Selling Process, Step by Step : from pre-listing preparation through closing day.
- Top 10 Mistakes Mid-Michigan Home Sellers Should Avoid : pricing and preparation lessons that apply in Oakland County too.
- Oakland County Communities : villages, downtowns, lakes, and neighborhoods Joyce serves.
- Lake Orion Community Guide : lake life, schools, and local character in northern Oakland County.
- Clarkston vs. Lake Orion: Oakland County Compared : how two of the county’s most sought-after communities differ.
- Oxford Township Community Guide : a small-town feel on Oakland County’s northern edge.
- Milford & Highland: Lakes and Trails in Oakland County : recreation and countryside in the county’s western communities.
Get a Personalized Oakland County Market Analysis
Your Home Deserves an Individual Assessment
Countywide statistics provide context, but your home, neighborhood, and price range deserve a closer look at the properties buyers are actually choosing. Whether you are buying, selling, or deciding when to make your next move, I can help you interpret the local data and build a practical plan.
Get a Home ValuationOr call 810-513-3335

Keller Williams First · Licensed since 2014 · 20+ years of real estate industry experience · 810-513-3335
Data source: Realtors Property Resource® public records and listing data for Oakland County single-family homes, August 2026, supplied for this report. Statistics are countywide medians, are informational, and are not a guarantee of a particular result or future performance. Information is not intended to represent the value of an individual property. Equal Housing Opportunity.